
Men's College World Series By The Numbers
- Eye Test Analytics
- 3 days ago
- 1 min read

When- June 12-22
Where- Charles Schwab Field, Omaha NE
Format- Double Elimination Bracket Play/Best-of-3 Championship Series
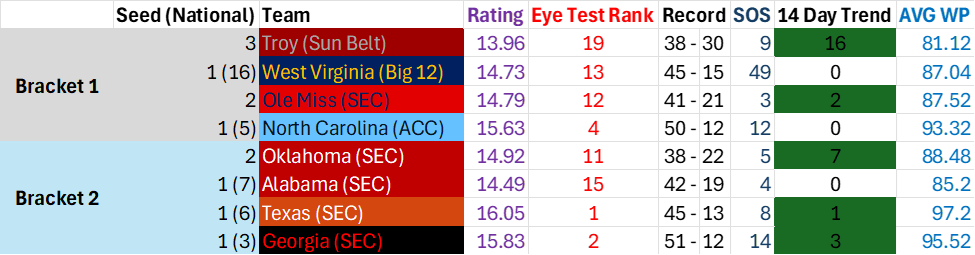
To determine the projected outcome of two teams on a neutral field subtract the difference in ratings. So if team A has a rating of 80 and team B has a rating of 75 team A would be projected to win by 5 runs. To determine the projected win probability of two teams on a neutral field subtract the difference in AVG WP and add 50. So if team A has a AVG WP of 80 and team B has an AVG WP of 75 team A would have a win probability of 55%. Below is the team's national ranking for each statistical category along with the average ranking of the past 5 champions. For ratings of all 308 D-1 schools visit eyetestanalytics.com/ncaa-baseball.
SOS= Strength of Schedule
BB= Walks Per Game
AVG= Team Batting Average
ERA= Team Earned Run Average
FP= Fielding Percentage
HR= Home Runs Per Game
BBA= Walks Allowed Per Game
SB= Stolen Bases Per Game
RF= Runs Scored Per Game
K= Opponent Strikeouts Per Game
HIT= Hits Per Game
RA= Runs Allowed Per Game
*Stats Courtesy of NCAA


Comments